


FMRP Atlas of the Mouse Brain
Original Publication: Zorio DA, Jackson CM, Liu Y, Rubel EW, Wang Y (2017). Cellular distribution of the fragile X mental retardation protein in the mouse brain. J Comp Neurol. 525(4):818-849. PDF
Animals
FMR1 knockout (Hemi FVB.129P2-Pde6b+; #004624) mice and their wild-type littermates (FVB.129P2-Pde6b+; #004828), purchased from the Jackson Laboratory.
Staining
Animals were perfused with 0.9% saline followed by 4% paraformaldehyde. Brains were sectioned coronally or parasagittally at 30 µm. Sections were stained for Nissl substance or immunocytochemistry for FMRP (7G1 and 2F5; Developmental Studies Hybridoma Bank). Antibody specificity was confirmed with western blot and immunocytochemistry in wildtype and FMRP knockout mice throughout the brain. The FMRP-epitopes recognized by 7G1 and 2F5 are amino acid 354-368 of mouse FMRP and amino acid 1-204 of human FMRP, respectively.
For each brain, every fourth sections were immunostained for one FMRP antibody, which contained 105-115 coronal sections from the spinal cord to the olfactory bulb or 50-60 parasagittal sections from lateral to the middle line. To avoid staining variations across slides and sections, sections within the same series were treated the same way and simultaneously whenever possible.
Imaging
For each section, image tiles were captured at 16 bits with a 20x lens and an Axiocam 503 color camera mounted on a Zeiss Imager M2 microscope. While imaging, a software Autofocus program in the Zeiss Zen software was applied to ensure all image tiles in focus. The image tiles were then montaged using the titling function of the Zeiss Zen software. This imaging protocol generated a single image of the entire section at a high resolution. All sections were captured and subsequently processed using the same parameters, so that the optic intensity of the background was within 1% deviation across images. Image brightness and contrast adjustments were performed using Adobe PhotoShop (Adobe System, Mountain View, CA). All drawings were produced in Adobe Illustrator (Adobe System).
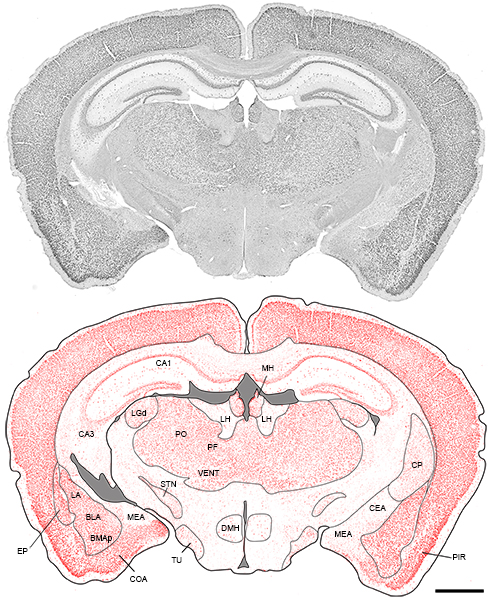
To reveal FMRP-rich cells throughout the mouse brain, we performed a pixel-based threshold analysis. The tiled image of an entire section was converted to 8 bit in black and white and used to generate a threshold image at the pixel brightness point of 114 using Fiji software. This threshold was chosen to reveal high intensities of FMRP staining and was applied to all sections analyzed.
Download high-resolution images (from caudal to rostral):
Spinal cord: 1, 2, 3, 4, 5,
Brainstem: 4, 5, 6, 7, 8
Thalamus: 9, 10, 11, 12, 13, 14, 15
Anterior cortex: 16, 17, 17, 19
Download will be available soon! Please contact Yuan Wang for image request.
Quantification
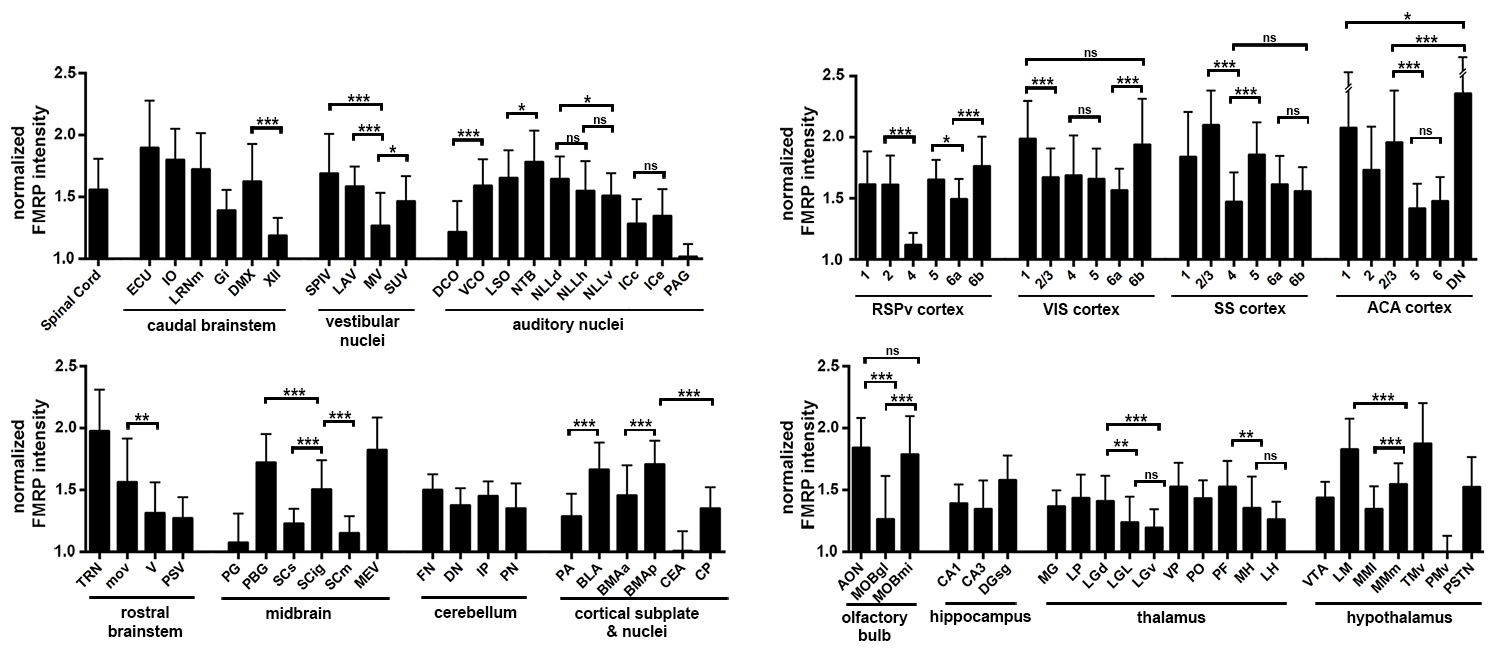
All quantitative analyses were based on measurements from 7G1 immunostaining. To compare FMRP expression levels between cell groups, we performed an intensity analysis on FMRP immunostaining at the individual cell level in eighty-five (85) selected neuronal cell groups. For each cell group, all 7G1-labeled coronal sections containing a significant portion of this cell group were identified. The most middle sections were used to determine the cells to be measured based on the following criteria: 1) its location can be unambiguously identified within the border of the cell group; 2) this cell has an identifiable cell boundary and a well-defined nucleus and; 3) the cross sectional cell body area of this cell is more than 40 µm2. To analyze a minimum of 30 cells from each cell group, a single section was used for large cell groups while multiple sections were used for smaller cell groups. Once a section was included in the analysis for a particular cell group, all cells matching the above criteria were measured.
For each selected cell, the mean optical intensity of FMRP immunostaining within the cell body was measured in the Fiji software (version 1.50e; National Institute of Health). After background subtraction, the optical intensity of each measured cell was normalized to the average optical intensity of all measured cells in the ventral premammillary nucleus (PMv), the cell group with the smallest average optical intensity among all measured cell groups. The background was measured in a region where there was no tissue present. Statistical analyses between cell groups were performed in the Prism software (Version 6; GraphPad Software, Inc.; La Jolla, CA) using either unpaired student t-test or one-way ANOVA followed with Tukey’s multiple comparisons test. Only cell groups presented and measured from the same sections were compared statistically to minimize false positive.
FMRP- rich neuronal cell groups in the mouse brain download the table
|
Spinal Cord |
Thalamus |
|
Grey matter |
Lateral geniculate complex, dorsal part (LGd) |
|
|
Lateral habenula (LH) |
|
Brainstem |
Lateral posterior nucleus of the thalamus (LP) |
|
Abducens nucleus (VI) |
Medial geniculate complex (MG) |
|
Dorsal motor nucleus |
Medial habenula (MH) |
|
of the vagus nerve (DMX) |
Parafascicular nucleus (PF) |
|
External cuneate nucleus (ECU) |
Posterior complex of the thalamus (PO) |
|
Facial motor nucleus (VII) |
Ventral group of the dorsal thalamus (VENT) |
|
Gigantocellular reticular nucleus (GRN) |
Ventral posterior complex of the thalamus (VP) |
|
Gracile nucleus (GR) |
|
|
Inferior olivary complex (IO) |
Hypothalamus |
|
Lateral reticular nucleus, |
Dorsomedial nucleus of the hypothalamus (DMH) |
|
magnocellular part (LRNm) |
Lateral mammillary nucleus (LM) |
|
Motor nucleus of the trigeminal (V) |
Medial mammillary nucleus, medial part (MMm) |
|
motor root of the trigeminal nerve (moV) |
Parasubthalamic nucleus (PSTN) |
|
Nucleus of the lateral lemniscus (NLL) |
Subthalamic nucleus (STN) |
|
Nucleus of the trapezoid body (NTB) |
Tuberal nucleus (TU) |
|
Nucleus raphe obscurus (RO) |
Tuberomammilliary nucleus, ventral part (TMv) |
|
Nucleus raphe pallidus (RPA) |
|
|
Pontine gray (PG) |
Cerebral Cortex |
|
Principal sensory nucleus |
Isocortex – all areas |
|
of the trigeminal (PSV) |
Basolateral amygdalar nucleus (BLA) |
|
Spinal nucleus of the trigeminal (SPV) |
Basomedial amygdalar nucleus, |
|
Superior olivary complex (SOC) |
posterior part (BMAp) |
|
Lateral superior olive (LSO) |
Claustrum (CLA) |
|
Medial superior olive (MSO) |
Cortical amygdalar area (COA) |
|
Superior paraolivary nucleus (SPO) |
Endopiriform nucleus (EP) |
|
Tegmental reticular nucleus (TRN) |
Lateral amygdalar nucleus (LA) |
|
Ventral cochlear nucleus (VCO) |
|
|
Vestibular nuclei (VNC) |
Cerebral Nuclei |
|
Lateral vestibular nucleus (LAV) |
Caudoputamen (CP) |
|
Spinal vestibular nucleus (SPIV) |
Diagonal band nucleus (NDB) |
|
Superior vestibular nucleus (SUV) |
Globus pallidus (GP) |
|
|
Intercalated amygdalar nucleus (IA) |
|
Cerebellum |
Islands of Calleja (isl) |
|
Dentate nucleus (DN) |
Medial amygdalar nucleus, |
|
Fastigial nucleus (FN) |
posteroventral part (MEApv) |
|
Interposed nucleus (IP) |
Olfactory tubercle (OT) |
|
Granular cells |
|
|
Purkinje neurons |
Hippocampus |
|
|
Dentate gyrus (DG) |
|
Midbrain |
Field CA1 (CA1) |
|
Inferior colliculus (IC) |
Field CA2 (CA2) |
|
Midbrain trigeminal nucleus (MEV) |
Field CA3 (CA3) |
|
Parabigeminal nucleus (PBG) |
|
|
Red nucleus (RN) |
Olfactory |
|
Substantia nigra, compact part (SNc) |
Accessory olfactory bulb (AOB) |
|
Superior colliculus, intermediate gray layer (SCig) |
Anterior olfactory nucleus (AON) |
|
|
Main olfactory bulb (MOB) |
|
|
glomerular layer (MOBgl) |
|
|
granule layer (MOBgr) |
|
|
mitral layer (MOBmi) |
|
|
Nucleus of the lateral olfactory tract (NLOT) |
|
|
|